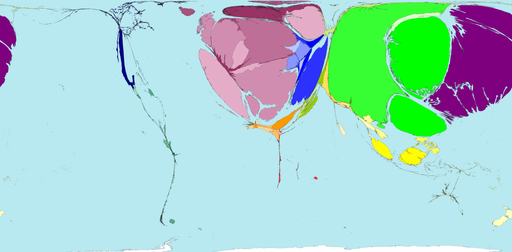
Eastern Asia, Western Europe and Japan are the main ore importing regions. Over two thirds of the territories in these regions have ore imports (net US$). There are only very low levels of ore imports to territories in any other region. Half of the territories in the main ore exporting regions (South America and Asia Pacific) actually have net ore imports. However, these net imports are considerably lower than the net exports made by the other territories in those regions. It is likely that once these imported ores have been processed they will move again, in a new form, perhaps as iron, steel or finished goods. Territory size on the map shows the proportion of worldwide net imports of ores (in US$) that are received there. Net imports are imports minus exports. When exports are larger than imports the territory is not shown. |
Rank | Country | Imported ores value USD/capita/year |
1 | Luxemburg | 809 |
2 | Island | 244 |
3 | Norvey | 193 |
4 | Finnland | 147 |
5 | Belgium | 85 |
6 | Korea | 72 |
7 | Qatar | 71 |
8 | Taiwan | 67 |
9 | Slovenia | 60 |
10 | Japan | 49 |
