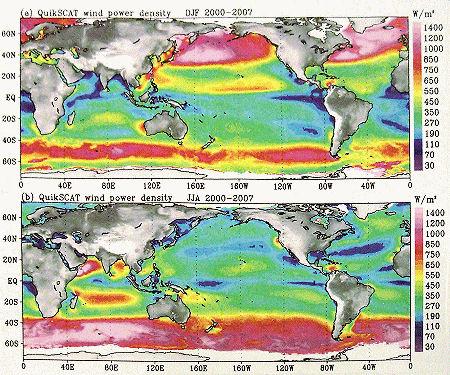
The chart above is from Earth magazine October 2008. It shows where the wind power is over the oceans with colors but over the continents it isn’t measured. The top chart is for December, January, February and the bottom one is for June, July, August. The following is from my earlier blog, “Oceans of wind power are available for humanity’s use.”
The wind energy available is greater than all humanity needs to power its vast and energy wasteful high tech civilizations. But the way that it is being collected at the moment with windmills has two very severe problems. 1. The places where the energy is needed most isn’t where the wind blows with the greatest consistency and energy. 2. The windmill collection systems tap only the very bottom layer of a very deep supply of energy. Below is a chart of where the wind blows with the greatest energy potential. A quick glance shows that the best place to collect energy year around is a north-south band all the way around the world at the latitudes between Africa and Antarctica .
If it is about collecting the wind for use as a power source these pink and red areas are where it will eventually come from with the greatest abundance. How to collect that vast supply of energy becomes the problem to solve but it is fairly obvious once you look at the problem. Windmills are okay for collecting energy from the bottom 30 meters but the wind is blowing in a recoverable fashion up to 3,000 meters, 100 times the amount of energy, if you use the appropriate technology. It would be impossible to construct a tower with a windmill to those dimensions in the middle of these oceans and it isn’t needed. The way to collect that energy is with specialized kites and power conversion systems.
When one refers to kites people instantly think of children’s kites. That isn’t quite what I have in mind but it is helpful for a quick comparison. A human’s basic energy consumption is abut 70 watts, the same as a typical tungsten-filament light bulb. A quick glance at the map above shows that the dark blue regions are 70 watts per square meter which means the energy of a child’s kite one meter on a side is capable of generating enough energy to equal your living processes. But the chart above shows very large regions where the energy density is 1400 W/m2 and that is enough energy for 14 or more people. Or enough energy for you and your house and battery powered electric car.
From Wikipedia, “air at sea level and 20 °C has a density of approximately 1.2 kg/m3.” Now look at the sky overhead and imagine 3,000 meters of 1 kg/m3 flowing by at the rate those clouds are going. 3,000 kg going 10 m/sec. It’s a lot of energy everywhere but there is a lot more of it over the Southern Ocean.
http://probaway.wordpress.com/2009/03/15/wind-energy/
